Smart Ways to Find Vertical Asymptotes in 2025
Understanding Vertical Asymptotes in Mathematical Functions
**Vertical asymptotes** are crucial elements in calculus and are often encountered in the study of rational functions. They represent values where a function’s output becomes infinite, indicating a discontinuity in the graph. Specifically, vertical asymptotes can be identified at points where the denominator of a rational expression equals zero, assuming the numerator does not equal zero at those points. For students and educators, mastering the concept of asymptotes in functions is essential for analyzing limits and sketching accurate graphs. Understanding the vertical line test can serve as a practical method for spotting these asymptotes, and this test solidifies the concept of discontinuities in functions by confirming where a graph fails to hold continuity.
Identifying Vertical Asymptotes
Identifying **vertical asymptotes** hinges on recognizing which values of the independent variable (often x) cause the denominator of a rational function to equal zero, leading to undefined behavior for the function. For instance, when analyzing the function f(x) = 1/(x – 2), we find that setting the denominator equal to zero results in x = 2, thus indicating a vertical asymptote at this value. It’s important to note, however, that if the numerator also equals zero at this point, then this situation results in a removable discontinuity rather than a vertical asymptote.
In structured diversity, we can expand our focus on rational functions like f(x) = (x + 1)/(x^2 – 1). Here, we determine the vertical asymptotes by factoring the denominator (x – 1)(x + 1) and finding its zeros, thus identifying the points x = 1 and x = -1 as vertical asymptotes. This approach illustrates essential algebraic techniques and underlines the necessity of factoring polynomials effectively.
Behavior Near Vertical Asymptotes
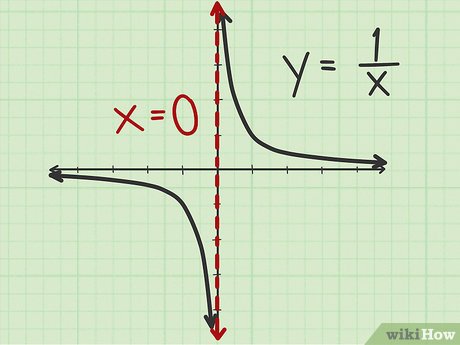
The behavior of functions near **vertical asymptotes** is another critical aspect of understanding rational expressions. As the function approaches the asymptote from either direction, its value tends to infinity or negative infinity, manifesting significant graphs that may exhibit steep curves. For example, in the function f(x) = 1/(x – 1), as x approaches 1 from the left, the function output dips toward negative infinity. Conversely, from the right, the output trends toward positive infinity.
Such **asymptotic behavior** is pivotal for graphing rational functions. Thus, anticipating how the function behaves as it nears the asymptote can lead to clearer outlines when sketching the graph. Additionally, if students employ tools such as a vertical asymptote calculator, they can visualize function behavior and validate theoretical findings through numerical analysis.
Calculating Vertical Asymptotes Effectively
Calculating **vertical asymptotes** is typically straightforward, yet it often evolves into a more profound understanding of limits and continuity. To solve problems effectively, one must ensure they alleviate common misunderstandings associated with \(x\)-intercepts and vertical asymptotes, as they often overlap in terms of the functions they impact. When determining vertical asymptotes, always confirm the degree of polynomial functions involved; should a higher degree arise in the numerator than in the denominator, a horizontal asymptote may also represent function behavior surprisingly.
Using Limits to Find Vertical Asymptotes
One of the most effective methods for calculating vertical asymptotes is through the use of limits. If a limit approaches infinity as x approaches a certain value, then a vertical asymptote likely exists at that point. For example, the limit expression **lim (x → c) f(x) = ±∞** indicates the presence of a vertical asymptote at x = c. This calculation directly connects to the definitions of limits and continuity, underpinning what happens to the function as it reaches cancelation points. A practical approach is to analyze the limits both from the left (−) and the right (+), ensuring comprehensive evaluation of discontinuities in functions.
Graphing Techniques for Visualizing Asymptotes
Graphing rational functions with identified **vertical asymptotes** aids students’ comprehension of mathematical definitions and asymptotic analysis. Utilizing points near the asymptotes allows for careful construction in graphing. By selecting values close to the vertical asymptote and calculating function outputs, one can depict where the graph approaches infinity sharply. Such exercises reinforce understanding by translating theory into practice, exemplifying how to sketch functions accordingly. As a case in point, if examining the function f(x) = 2/(x – 3), calculate values for x approaching 3, such as 2.9 and 3.1, which will showcase the steep rise and decline at this vertical asymptote.
Examples and Applications of Vertical Asymptotes
Applying knowledge of **vertical asymptotes** through examples enriches the learning experience significantly. When dissecting real-world applications or theoretical problems, students often encounter functions that can be represented with vertical asymptotes, particularly in physics with projectile motion or in economics involving earnings ratios. By methodically calculating, characterizing, and graphing these types of functions, rigorous evaluation can lead learners to witness vertical asymptotes manifest in viable scenarios.
Real-World Applications of Vertical Asymptotes
In finance, rational functions and their associated **vertical asymptotes** may appear in financial modeling, specifically where calculations cannot realistically fulfill certain conditions, such as negative earnings or growth ratios reaching bounds. By identifying poles in ratios, analysts can precisely anticipate critical points that need management attention. Similarly, physical models in kinematics may depict forces that approach infinity under specific conditions, demonstrating the strength of **asymptotic behavior** in reactions.
Identifying and Analyzing Functions with Multiple Asymptotes
Some functions can possess multiple vertical asymptotes, rendering the study of graphing complexity. A prominent example is the function f(x) = 1/(x^2 – 4), showcasing vertical asymptotes at x = -2 and x = 2. Analyzing such functions involves understanding how limits interact through various sections of the graph, transforming our interpretation of behavior near these points. By applying techniques for finding asymptotes, one develops essential mathematical intuition, a necessary skill set for anyone interested in advanced calculus or function analysis.
Key Takeaways
- Understanding the definition and identifying locations of vertical asymptotes is crucial for successful graphing of rational functions.
- Limits serve as powerful tools for detecting vertical asymptotes and understanding their behavior near discontinuities.
- Application examples deepen awareness of vertical asymptote relevance in real-world situations, enhancing theoretical knowledge.
- Multiple vertical asymptotes can complicate graphing efforts, underscoring the importance of in-depth learning of function characteristics.
FAQ
1. What is the significance of vertical asymptotes in calculus?
Vertical asymptotes mark points in a function where the function approaches infinity and signifies discontinuities at certain values. Understanding them is essential for students to accurately grasp limits and their roles in graph behavior. They shape interpretations of function characteristics and are central to analyzing behavior near critical points.
2. Can a function have more than one vertical asymptote?
Yes, functions, especially rational functions, can have multiple vertical asymptotes. This occurs when the denominator has more than one root that leads to discontinuities within the function. Each root contributes to a unique vertical asymptote along the x-axis.
3. How do I determine if a vertical asymptote is removable?
A vertical asymptote is classified as removable if both the numerator and the denominator share a common factor that cancels out when simplified. In other words, if a function’s undefined point results from a zero in both the numerator and denominator, the discontinuity could potentially be removed.
4. What role does the vertical line test play in identifying asymptotes?
The vertical line test is a graphical method used to check whether one value of x corresponds to only one value of y. This test can help confirm behaviors around **vertical asymptotes** by verifying where the function fails to adhere to continuity, which leads to understanding function behavior at these crucial values.
5. Where can I find additional resources on vertical asymptotes and rational functions?
Many online educational platforms offer comprehensive materials on vertical asymptotes and **asymptotic analysis**. Websites like https://fixskill.info provide articles and tutorials aimed at deepening your understanding of these mathematical concepts, supporting better function evaluation and analysis.