Effective Ways to Find the Y-Intercept in 2025
The concept of the y-intercept is fundamental in the study of algebra and coordinate geometry. Understanding how to accurately determine the y-intercept using various methods can simplify graphing linear functions and solving equations. In this article, we will explore different, effective techniques to calculate the y-intercept, discuss its significance in linear equations, and provide relatable examples. Whether you are a beginner or someone looking to reinforce your knowledge, this guide will assist you in mastering the y-intercept and its applications.
Understanding the Y-Intercept
The y-intercept is the point where a line crosses the y-axis on a coordinate plane. It is an essential component of linear equations, particularly in the slope-intercept form, expressed as y = mx + b, where ‘m’ represents the slope and ‘b’ denotes the y-intercept. By analyzing this definition, we can begin to outline methods to find the y-intercept from different perspectives.
Y-Intercept Definition and Significance
The y-intercept meaning is integral to understanding how a function behaves. It represents the value of ‘y’ when ‘x’ equals zero. For example, in the linear equation y = 2x + 3, when we substitute ‘x’ with zero, we can determine that the y-intercept is 3. The significance of this point is clear; it defines where the graph of a function begins in relation to the coordinate axes and helps in plotting the graph accurately.
Finding the Y-Intercept from an Equation
To calculate the y-intercept using an equation, one should follow a straightforward method. Simply set the variable ‘x’ to zero and solve for ‘y’. For example, consider the equation y = -5x + 10. By substituting ‘x’ with zero, the equation becomes y = 10, indicating that the y-intercept is at that point (0,10). This technique applies to various forms of equations, including the linear function y-intercept, which reflects the aspect of direct linear relationships.
Graphing the Y-Intercept
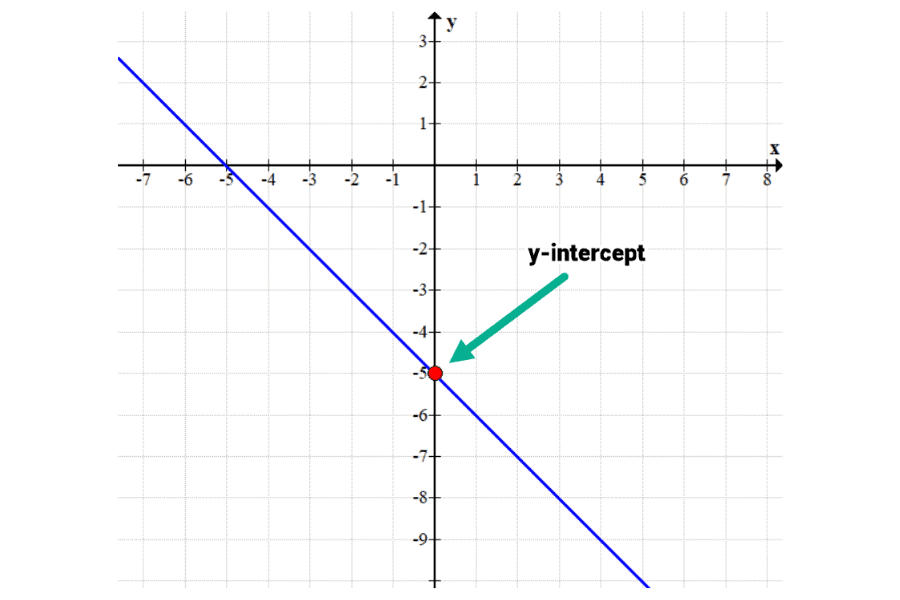
Graphing is another effective way of determining the y-intercept on a graph. When a linear equation is graphed, the point where the line intersects the y-axis is your y-intercept. For instance, when plotting the points of the equation y = 3x – 6, you will find it intersects the y-axis when ‘x’ equals zero, resulting in the point (0,-6). Using the graph to visualize the intercept can aid in better understanding how changes in the equation influence the graphical representation of the function.
Methods to Calculate the Y-Intercept
In addition to using equations and graphical representations, there are other methods to calculate the y-intercept. These methods include analyzing a set of coordinates or using point-slope form. It allows for flexibility in finding intercepts based on available data.
Using the Slope-Intercept Form
The slope-intercept form is a favored approach to finding the y-intercept since it directly provides the information in a standard format. To illustrate, let’s take the equation y = 4x + 5. The term ‘5’ denotes the intercept at (0,5). To verify this, set ‘x’ to zero in that equation, demonstrating how convenient this form can be for solving slopes and plotting graphs quickly.
Finding the Y-Intercept from Points
If a linear function is defined by two points instead of an explicit equation, finding the y-intercept from coordinates is feasible. Assume we have two points, (2,4) and (4,8). First, calculate the slope (m) as (8-4)/(4-2) = 2, and express it in y = mx + b. Plugging in one point will allow solving for ‘b’, effectively leading to determination of the y-intercept coordinates.
A Practical Example: Real-World Application
Consider a practical scenario where a company determines its profit, represented by a linear function. If the profit in terms of items sold is given by y = 3x + 20, here we can easily find that the y-intercept equates to 20, indicating the company’s baseline profit before selling any items—a key understanding for analyzing financial metrics.
Visualizing the Y-Intercept in Graphs
Visual interpretation of the y-intercept provides a deeper understanding of mathematical concepts. Utilizing graphs allows learners to observe and interpret linear equations effectively. By identifying the intercept points, various characteristics of functions become clearer, enhancing the educational process.
Graphical Interpretation Techniques
To better visualize the y-intercept graph, various software and online tools can be utilized. Tools such as graphing calculators and interactive platforms help depict the intercepts dynamically, reinforcing understanding through visual stimuli. For example, if you plot multiple linear equations on the same graph, their respective intercepts can visually illustrate how different slopes affect intercepts rapidly.
Teaching Strategies for the Y-Intercept
Instructors should focus on employing interactive teaching methods to engage students better. Examples could include blending technology (via graphing software) with hands-on activities, such as plotting points on a physical coordinate plane. These strategies help students comprehend not just the process of finding the y-intercept but also the broader implications in mathematics.
Common Mistakes in Finding Y-Intercepts
While learning to find y-intercepts, students often encounter common pitfalls, such as misinterpreting slopes or neglecting to set ‘x’ to zero. Awareness and practice in detecting these errors can significantly enhance proficiency in dealing with linear equations. Regular comparisons of y-intercepts throughout different equations will bolster stronger conceptual grounding.
Key Takeaways
- The y-intercept is where a line crosses the y-axis and found by setting ‘x’ to zero in equations.
- The slope-intercept form offers a direct and simple way to obtain y-intercepts.
- Visual approaches, like graphing, reinforce understanding and highlight trends in data representation.
- Practicing through real-world contexts deepen the connection between mathematical concepts and their applications.
FAQ
1. How do I find the y-intercept from a linear equation?
To find the y-intercept from an equation, simply substitute 0 for ‘x’ in the equation. This will allow you to solve for ‘y’, which will provide the coordinate point for the intercept. For instance, in y = 2x + 7, substituting gives y = 7 when x=0, resulting in the coordinate (0,7).
2. Why is the y-intercept important in linear equations?
The y-intercept significance in linear equations is crucial as it offers insight into the initial conditions of the function. It indicates the starting value of the dependent variable and helps in plotting the line accurately, reflecting its behavior across the coordinate plane.
3. Can you provide examples of y-intercepts in real life?
Yes! In various fields such as economics, the y-intercept often reflects baseline values, like initial costs or fixed fees before scaling. For example, in a profit analysis, the y-intercept signifies the profit made without selling any products, providing vital context to evaluate profitability.
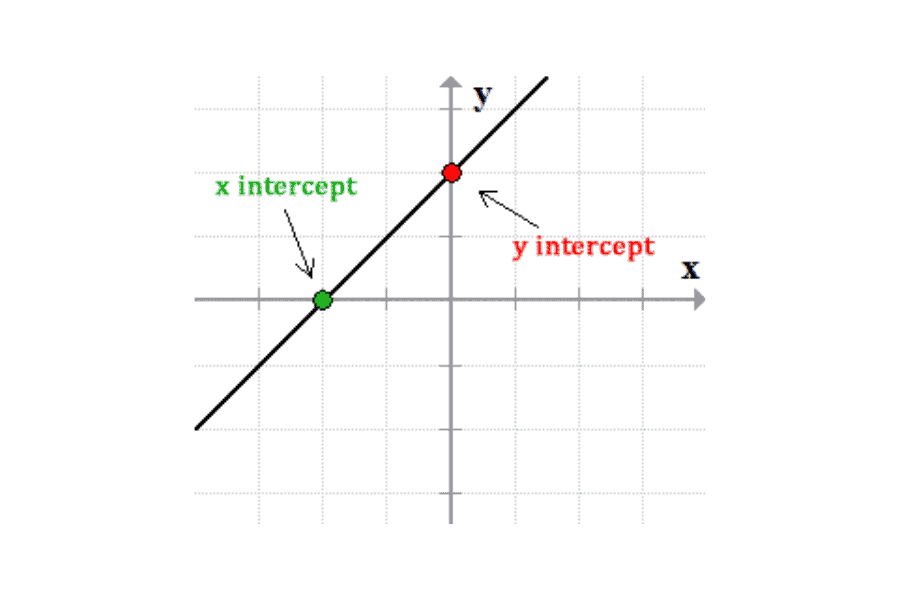
4. What is the difference between y-intercept and x-intercept?
The y-intercept and x-intercept are points where the line crosses the respective axes. The y-intercept occurs when ‘x’ equals zero, while the x-intercept is found when ‘y’ equals zero. Understanding both is vital for graphing lines effectively and identifying relationships in mathematical functions.
5. How might I confuse slope with the y-intercept?
It’s common to confuse slope with y-intercept, as both are critical components of linear equations. The slope indicates the rate of change, while the y-intercept conveys the starting value. Miscalculating either can lead to errors in graphing and interpretation, highlighting the importance of clearly distinguishing the two concepts.
6. What resources can I use to improve my understanding of y-intercepts?
Numerous educational math resources are available, including online tutorials, interactive graphing software, and practice problem worksheets. Websites like Khan Academy and various Youtube channels provide excellent visual aids and comprehensive walkthroughs of algebraic concepts related to the y-intercept.
7. What role does the y-intercept play in statistics?
In statistics, the y-intercept can signify baseline values in regression analysis. It represents the outcome when all predictors are at zero, helping analysts understand starting trends in various data sets. Recognizing its significance boosts interpretation skills in statistical modeling.
Images of Y-Intercept Methods
For more details on these concepts, feel free to visit this resource or learn in-depth at this page.